1 User Experience Report Card$299
X
Report cards are confidential. We'll never share your email.

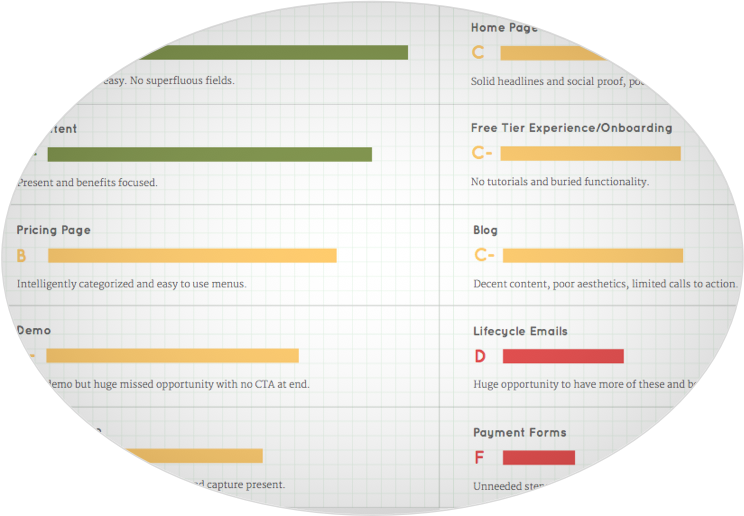
We’ll examine up to 15 key steps in your funnel and give them each a grade, from A+ to F. The lower the grade, the greater the opportunity for improvement.
You’ll also get notes on each section, an overall grade for your whole funnel, and a 20 minute walkthrough by phone.
Whether or not you decide to enlist our help, waiting to find and address high friction areas means continuing to lose revenue. Before developing costly new features or running a big marketing campaign, consider first consolidating and making the most out of the funnel you’ve already established. We’ve helped clients realize improvements of over 35% through simple changes.
The price? $499. But we’re cutting it to $299 for a limited time. Either way, it’s nothing compared to what this can do for your bottom line.


On this report card, bad grades are good! It means there’s a good chance that some lucrative gains are ripe for the picking. And it doesn’t mean anyone screwed up—there never has been and never will be a piece of software with perfect user experience. It’s fundamentally difficult to get right, and at some point you just have to ship.
But that doesn’t mean you can’t occasionally circle back and smooth out important paths that were neglected during the push. If you never do, you’ll quickly end up paying a huge penalty, and you may not even realize you’re paying it.
User experience design, like all types of design, has its subjective aspects. But it can be approached scientifically too. The most subjective issues are often the most marginal. The big wins are generally not found in tweaking colors and slogans, but in streamlining important workflows that clearly require superfluous thought and action.
For example, the exact number of decisions and interactions necessary to reach a particular goal can be counted, and that count can be compared with other possible designs. When a new design is decided on, it should be AB tested against the original verison to ensure it’s really an improvement. Often it won’t be. A failed test is not a failure—it’s an experimental outcome that can yield a huge amount of insight and lead to success on subsequent attempts.
We also offer a full funnel analysis package that includes the report card, a thorough user experience audit, an analytics audit, datamining, revenue projections, and a strategy session. Go here to learn more.
Under the right circumstances, we’re open to customized arrangements too.
More questions? Don’t hesitate to drop us an email: commence@smoothconversion.com.

Report cards are confidential. We'll never share your email.